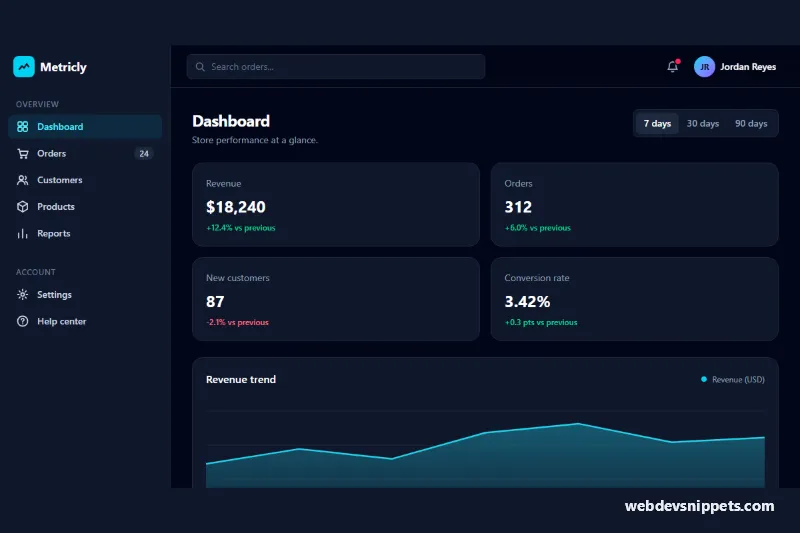
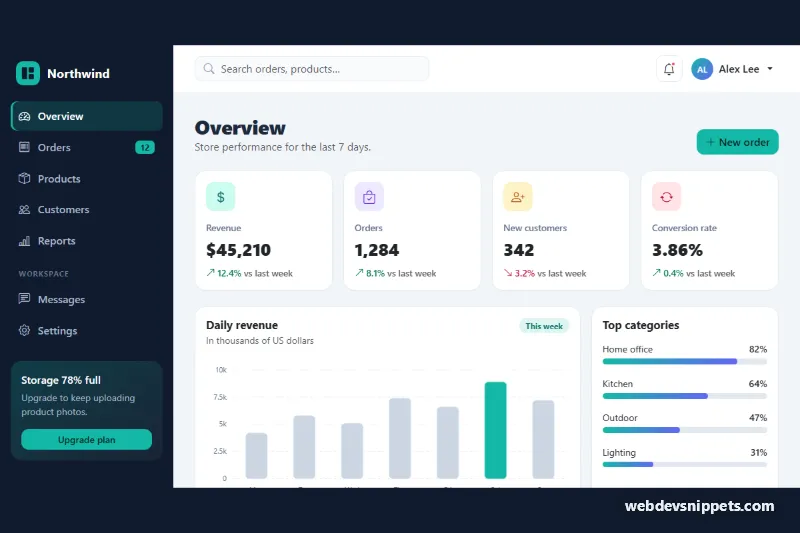
A dark admin dashboard layout built with Tailwind CSS and vanilla JavaScript. It combines a collapsible sidebar, a sticky topbar with search, four KPI stat cards, an SVG revenue chart with date-range buttons, a top-products list and a recent-orders table.
How it works
The root .tad-app is a flex layout. The aside.tad-sidebar is static from lg up; below that, style.css moves it off screen and hides it with visibility, and the hamburger button marked data-tad-open slides it in by setting a data-open attribute. A blurred [data-tad-overlay] button covers the page while the drawer is open. Clicking the overlay or the data-tad-close button, or pressing Escape, closes it and returns focus to the hamburger.
The range buttons (data-tad-range="7d", "30d", "90d") update everything at once. Each [data-tad-stat] and [data-tad-delta] element stores its value per range in data-7d, data-30d and data-90d; delta lines turn rose when the value starts with a minus sign. The chart is an inline SVG: the script reads the SERIES object, builds the [data-tad-line] and [data-tad-area] paths, prints the axis labels into [data-tad-labels] and writes a text version of the data into the [data-tad-chart-desc] caption. The tad-draw class animates the line on each change. The topbar data-tad-search form filters the rows in [data-tad-rows] as you type and shows [data-tad-empty] when nothing matches.
Customization
SERIESat the top ofscript.js: replace thelabelsandvaluesarrays with data from your API; the paths rescale automatically.data-7d,data-30danddata-90don stat elements: set the KPI text for each range.cyan-400utilities and the#22d3eestroke and gradient stops in the SVG: change the accent color.w-64on.tad-sidebar: make the sidebar wider or narrower.max-width: 1023.98pxinstyle.csstogether with thelg:classes: change the breakpoint where the sidebar becomes a drawer.- Status badges such as
bg-emerald-400/10 text-emerald-300: add new states by copying a badge and changing the color name.
Accessibility
The sidebar is labelled, the current page link carries aria-current="page", and the drawer button exposes aria-expanded. While closed on small screens the drawer uses visibility: hidden, so its links are not reachable with Tab. Range buttons use aria-pressed, the stat list is a polite live region, and the chart has role="img" with a caption that lists every value. The scrollable table wrapper is focusable and labelled, headers use scope="col", and transitions stop under prefers-reduced-motion: reduce.
Usage notes
The chart needs no library. For live data, fetch your numbers, update SERIES and trigger a click() on the active [data-tad-range] button to redraw it.