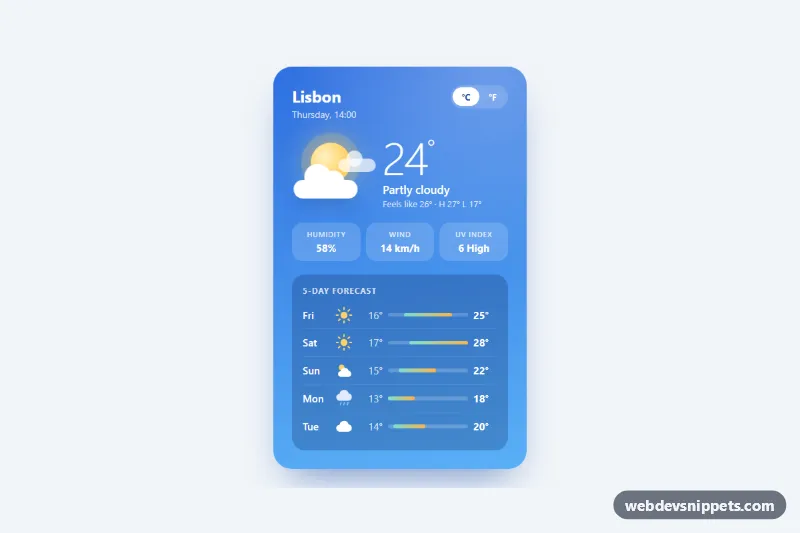
A sky-blue weather card in pure CSS and vanilla JavaScript, with a CSS-drawn sun and drifting clouds, the current temperature, three quick stats and a five-day forecast with range bars. A small switch converts every value between Celsius and Fahrenheit. Use it in dashboards, travel sites, smart-home panels or as a sidebar widget.
How it works
The root article.wc-card starts with a hidden svg.wc-sprite that defines four icon symbols (#wc-i-sun, #wc-i-cloud, #wc-i-partly, #wc-i-rain), reused in the forecast with <use>. The .wc-head shows the city, the time and the .wc-units button group. In .wc-now, the .wc-hero illustration is drawn entirely with CSS: .wc-sun is a radial gradient that softly pulses with the wc-glow keyframes, and each .wc-cloud is a pill whose ::before and ::after circles form the puffs, drifting with wc-drift. Next to it .wc-temp, .wc-cond and .wc-feels show the reading. The dl.wc-stats grid holds humidity, wind and UV, and .wc-forecast lists the days as .wc-day rows.
Every temperature is a span with the Celsius value in data-wc-c, and the wind speed uses data-wc-kmh. On DOMContentLoaded the script initializes every .wc-card. A click on a .wc-unit button converts all those values, swaps "km/h" for "mph", updates aria-pressed and stores the choice in data-wc-unit. It also reads data-wc-min and data-wc-max from each day, finds the weekly extremes and sets --wc-start and --wc-end on .wc-range-fill, so every bar sits on the same scale. Without JavaScript the card still shows Celsius values and full-width bars.
Customization
data-wc-uniton.wc-card: set tofto start in Fahrenheit.data-wc-con any temperature span anddata-wc-kmhon the wind value: put your API data here (always in metric); the visible text is generated from them.data-wc-minanddata-wc-maxon each.wc-day: the low and high that position its range bar.--wc-sky-topand--wc-sky-bottom: the gradient of the card; try dark navy for a night variant.--wc-cooland--wc-warm: the two ends of the range bar gradient.--wc-drift: the cloud movement duration; larger values make it slower.- Swap the
hrefof a<use>element, for example to#wc-i-rain, and update itsaria-labelto change a forecast icon.
Accessibility
The card is an article labelled by the city heading, and the forecast is a labelled section with a list. The unit buttons form a role="group" named "Temperature unit" and expose their state with aria-pressed; a polite live region announces the new unit. Forecast icons have role="img" and an aria-label, while the decorative hero and range bars are aria-hidden. Buttons show a white :focus-visible outline. With prefers-reduced-motion: reduce the sun and clouds stop moving.
Usage notes
Fetch data from your weather API, fill the data attributes and call the same conversion logic. Several cards can share a page because each one is initialized separately.