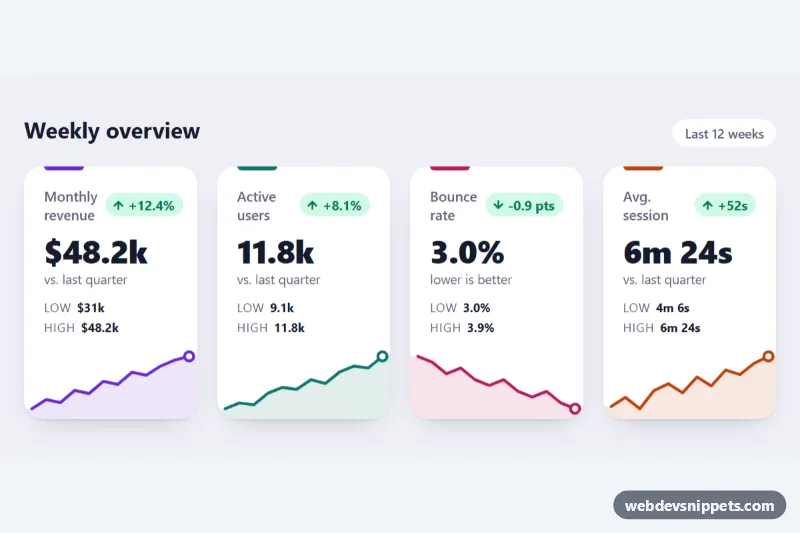
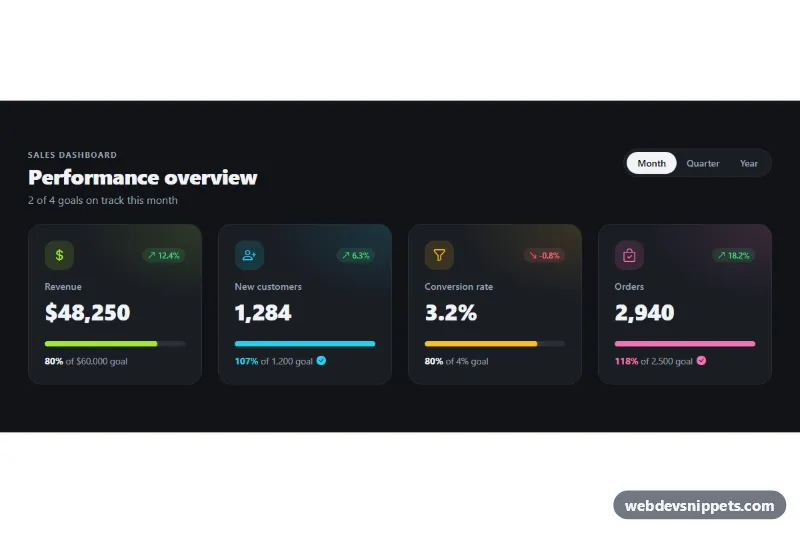
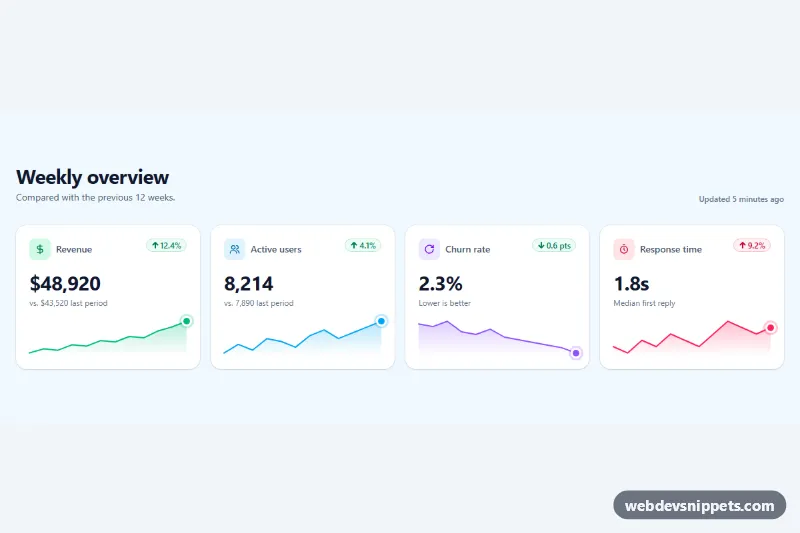
A row of four KPI stat cards in pure CSS with inline SVG sparklines, no JavaScript and no chart library. Each card shows a metric name, a large value, a colored trend badge, the low and high of the period and a small area chart that runs to the card edges. Use it at the top of admin dashboards, analytics pages or reports.
How it works
The root section.sks-board holds a header with the title and a period label, and a ul.sks-grid of li.sks-card elements. The grid shows one column on phones, two from 560px and four from 800px. Each card contains .sks-top (the h3.sks-label and a .sks-delta badge with an arrow icon), the .sks-value, a .sks-note, a dl.sks-range with the low and high values, and an svg.sks-spark.
The sparkline is plain SVG with a viewBox of -6 0 132 58, so it keeps its aspect ratio and grows with the card. .sks-area is the filled shape under the line, extended slightly past both ends so it reaches the card edges. .sks-line is the stroke and .sks-end is a circle on the latest data point. All three take their color from --sks-color, which each modifier class sets.
The line has pathLength="1" and stroke-dasharray: 1, so it can be drawn with one keyframe. When the visitor hovers over a card, the sks-draw animation redraws the line from left to right and sks-pop brings the end dot back in. On load the chart is fully visible.
Customization
.sks-card--violet,.sks-card--teal,.sks-card--roseand.sks-card--amber: each sets--sks-colorfor the top accent bar, the line, the area and the end dot; add a modifier for a new series color..sks-delta--goodand.sks-delta--badon the badge: green or red, independent of the arrow, so a falling bounce rate can still be shown as good..sks-delta--up/.sks-delta--down: swap the arrow path inside the badge to match the direction.--sks-strokeon.sks-board: the thickness of the sparkline.--sks-draw: the duration of the redraw on hover.- The
dattribute of.sks-lineand.sks-area: replace the points with your own data; x runs from 0 to 120 and y from 50 (lowest) to 10 (highest). - The
800pxmedia query on.sks-grid: change when the cards switch to four columns.
Use cases
- Admin dashboards: a row of four KPI cards at the top shows key numbers with trend badges
- Analytics pages: each metric has a sparkline and a low and high range for the period
- Reports: colored up and down badges show whether a change is good or bad at a glance
- SaaS products: revenue, users or conversion cards use inline SVG charts without a chart library
- Marketing dashboards: hovering a card redraws its sparkline to draw attention to the trend
Accessibility
Each sparkline has role="img" and an aria-label that states the trend in words, such as the start and end values, so screen reader users get the same information as the chart. The badge icons are aria-hidden, and the change is written out as text. Text colors meet WCAG AA contrast on white, and the low/high values use a description list. With prefers-reduced-motion: reduce the hover redraw is turned off.
Usage notes
Generate the paths on the server or at build time from your data. Several boards can share a page: the cards use no IDs, only the heading does, so give each board's sks-heading id and aria-labelledby a unique value.