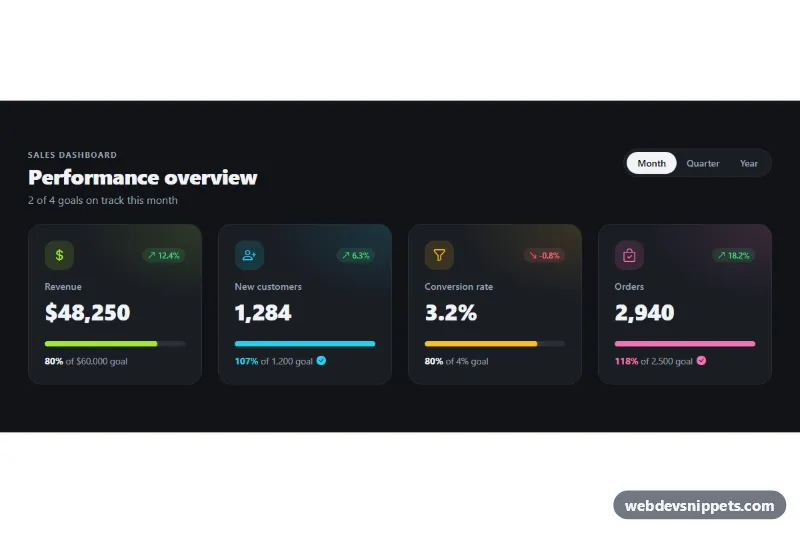
KPI Cards with Progress
Dark Bootstrap 5 KPI cards with trend badges, goal progress bars and a Month, Quarter and Year switch for admin and sales dashboards.
KPI tiles for dashboards.
2 component(s)
Dark Bootstrap 5 KPI cards with trend badges, goal progress bars and a Month, Quarter and Year switch for admin and sales dashboards.
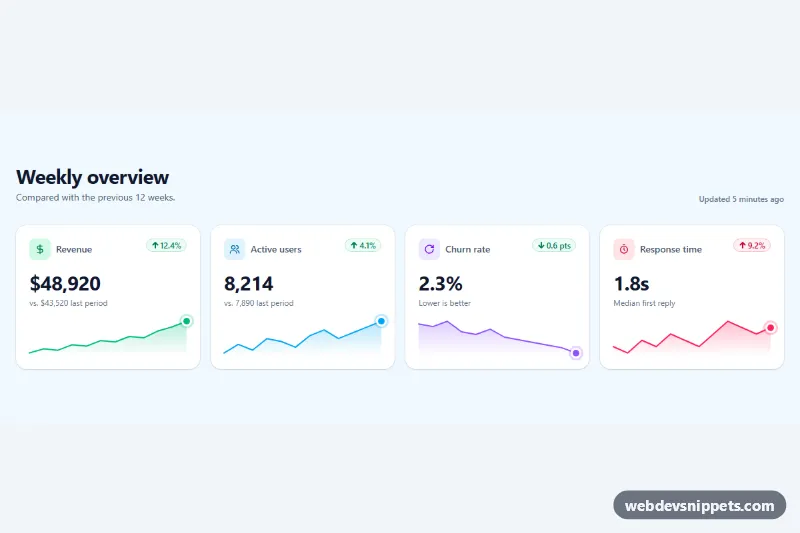
Tailwind CSS KPI stat cards with change percentage pills and animated SVG sparklines generated from a data attribute.
A stat card, also called a KPI tile or metric card, shows one key number with a short label and often a trend: revenue this month, active users, conversion rate, open tickets. Rows of stat cards usually sit at the top of admin dashboards and analytics pages so people can read the most important figures before diving into charts and tables.
font-variant-numeric: tabular-nums) so values align and do not jump when they update.aria-hidden="true" and keep the key value in text.The dashboard stat card examples here include simple KPI tiles, cards with icons, trend indicators, progress bars and mini charts. Bootstrap 6 snippets use theme-* colour roles for icon backgrounds and trend colours, so they work in light and dark themes. Bootstrap 5 snippets combine .card with grid and text utilities, Tailwind CSS snippets use grid and flex utilities, and pure CSS versions are framework-free. Use the live preview to compare designs, then copy the code or download it and plug in your own data.