
Stats Section with Background Image
Bootstrap 5 stats section with four key numbers in glass cards over a darkened background photo, with a count-up animation on scroll.
Highlight key numbers and metrics.
4 components
Bootstrap 5 stats section with four key numbers in glass cards over a darkened background photo, with a count-up animation on scroll.
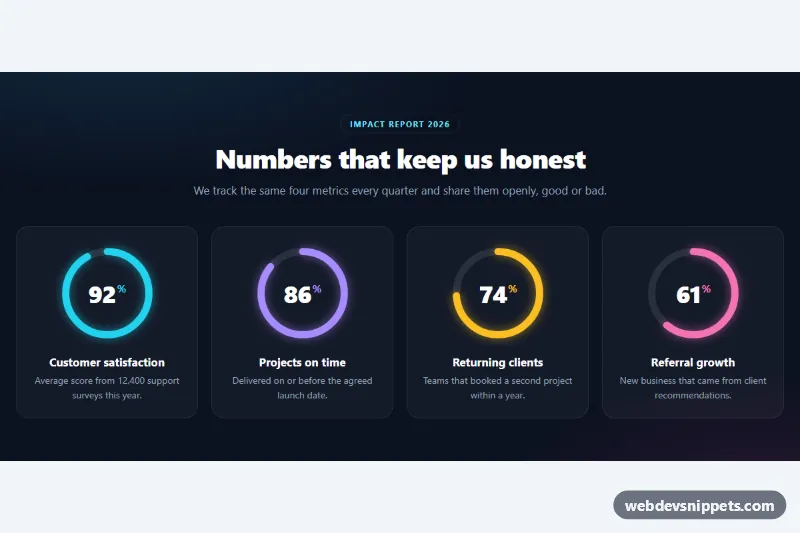
Dark stats section with four SVG circular progress rings that fill and count up to their percentage when scrolled into view.
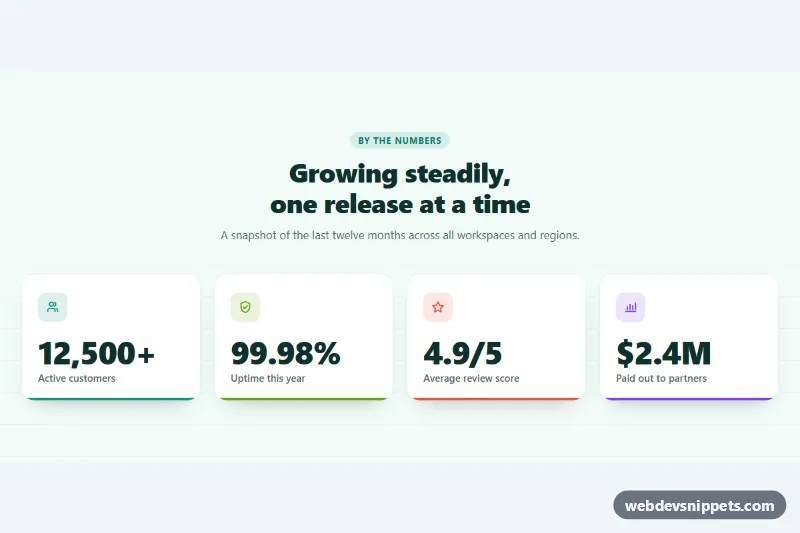
Stats section with four number cards that count up when scrolled into view, using IntersectionObserver, locale formatting and reduced-motion support.
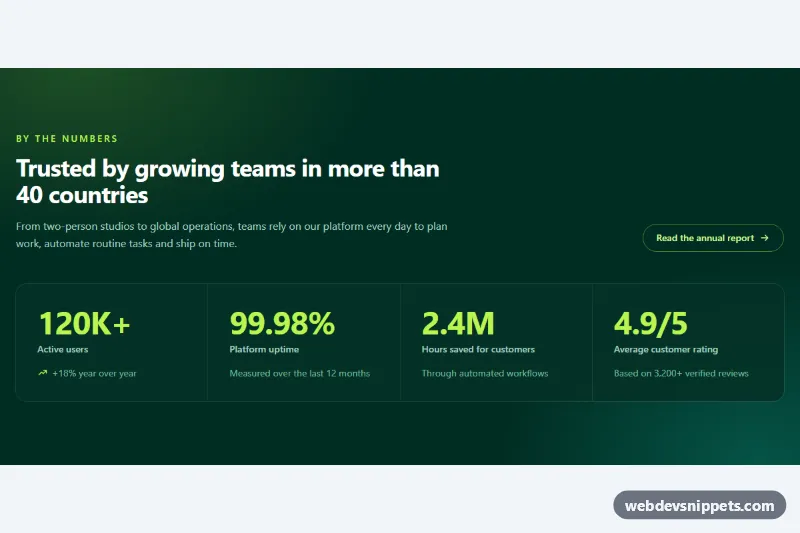
Tailwind CSS key-metrics section on an emerald brand background with large numbers, labels, trend notes and an accessible count-up on scroll.
A stats section highlights a handful of key numbers, such as customers served, uptime, downloads, years in business or projects completed. Each item pairs a large figure with a short label and sometimes an icon or a one-line explanation. Stats sections appear on landing pages, about pages, annual summaries and product pages to give quick, concrete evidence.
Use it when you have numbers that are meaningful to the visitor and easy to understand at a glance. Three or four strong figures work better than eight weak ones. Make sure every number is accurate and explain what it measures.
<dl>, <dt>, <dd>) is a good semantic fit.prefers-reduced-motion.font-variant-numeric: tabular-nums) so numbers align neatly.The stats section examples are built in Bootstrap 6, Bootstrap 5, Tailwind CSS and pure CSS. Bootstrap versions combine the grid with typography and border utilities, and Bootstrap 6 variants use the theme-* colour roles for highlighted figures. Tailwind CSS versions are utility-based, while the pure CSS versions use CSS Grid and custom properties; counter animations, where present, use a small script with an IntersectionObserver. Choose a framework with the filter, check the result in the live preview, then copy the code from the tabs or download it. Replace the numbers and labels with your own metrics and the section is ready.